

This article may reference legacy company names: Continental Mapping, GISinc, or TSG Solutions. These three companies merged in January 2021 to form a new geospatial leader [Axim Geospatial].
Why? Behind HIPAA security walls are spatial datasets meaningful for resource allocation and prioritization
Misrepresentation of data can lead to misinformation and faulty results in the analytical chain. During the current COVID-19 pandemic, broadening the publicly available datasets may be crucial in proper allocation of resources or answering the question of “where should we prioritize XYZ.” Much of this data may be stored behind a Health Insurance Portability and Accountability Act (HIPAA) security wall that would otherwise disallow dissemination of meaningful data to analysts. Getting meaningful datasets present in Protected Health Information (PHI) into the hands of the press, public, or researchers can present a challenge.
How? This spatial data be secured for safe distribution
MapMasq™ is an ArcGIS Plug-In developed to answer this very question. It is the first tool of its kind to work within a Geographic Information System (GIS) to tackle protecting the spatial component of protected data and privacy. With a growing demand for protected locational data to drive analytics, privacy becomes a greater concern. In order to stay HIPAA aligned, organizations must find ways to conceal their data. MapMasq offers a statistically founded solution that users can employ with confidence.
MapMasq™ allows health professionals to balance the importance of analyzing data geospatially while protecting sensitive health information.
Dr. Estella Geraghty, Chief Medical Officer
and Health Solutions Director at Esri
What is MapMasq?
MapMasq is a calculator, not a single push button solution. Various settings can be adjusted based on the expert knowledge of the user. Purpose built documentation is available to guide users in application as well as resources for standards and best practices. Methodologies behind the algorithms used in MapMasq can be found in referenced peer-reviewed journals available at www.mapmasq.com as well as resources for protecting PHI and HIPAA alignment.
Statistical Methods Utilized by MapMasq
K-Mean Neighbor
The MapMasq tool requires user inputs in order to process appropriately. K-Mean Neighbor requires that a K-Value be input as well as optional K Score ranges for min/max averages.

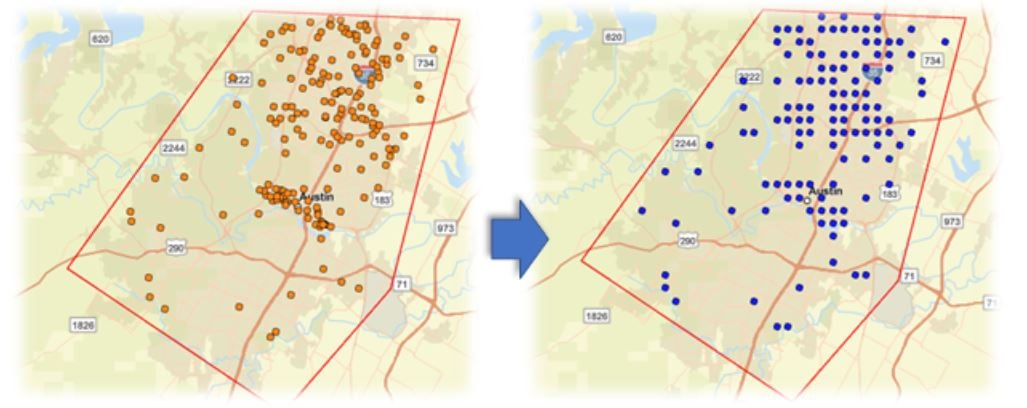
To better explain K-Mean, it is best to think about clustering. Choose a number K, which represents how many clusters one expects the data to have. Then make K guesses as to where those clusters could be. The guesses will likely be wrong, but that works just fine. For each element in the source data, they are added to the nearest cluster. Moving the centers of each of these clusters to be the middle of the elements that are assigned in each cluster and then repeat the steps until no more data points move from one cluster or another, or the k-limit has been met. The result will be a statistical representation of the data, spatially altered from the original input to protect PHI.
The result is a statistical representation of the data, spatially altered from the original input to protect PHI.
Kevin Bupp, MapMasq Product Manager
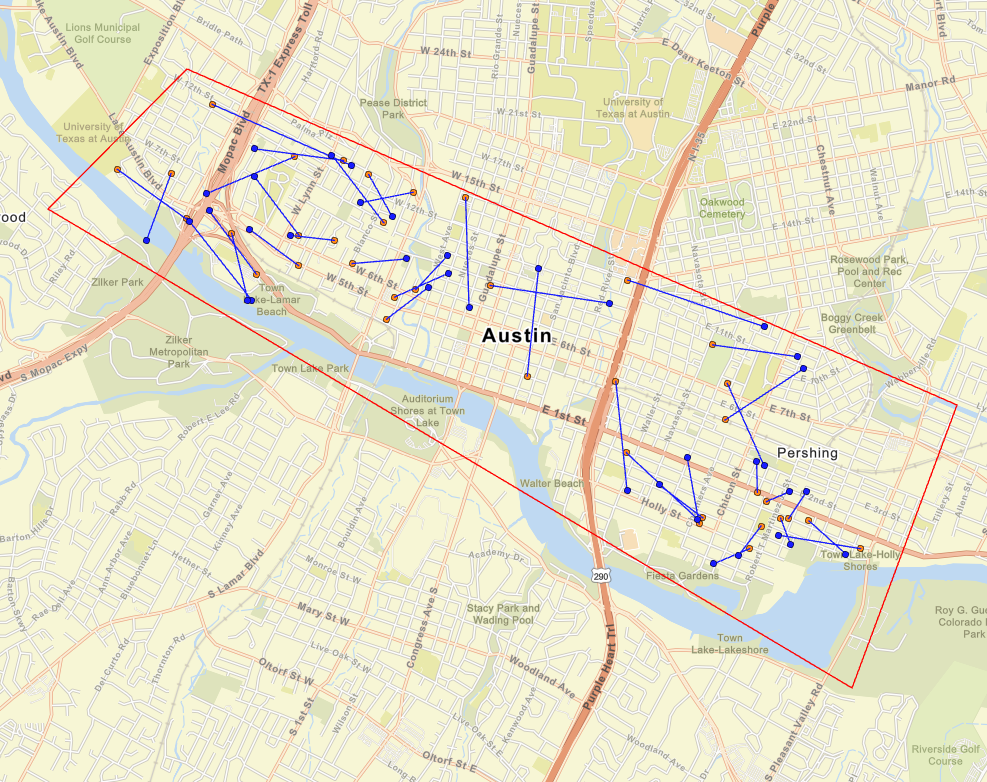
MapMasq exposes the statistics post-processing, prior to exporting the data. In this way, a user can refine K-Values, and K Score ranges to achieve the desired K-Anonymity score prior to publishing. Once published this data can be used by researchers, the press, or the general public to see individual data points without releasing PII/PHI.
Coordinate Rounding/Coordinate Truncation
MapMasq can also consolidate points based on latitude/longitude inputs. Both methods can take given data inputs and trim off precision of the data thereby conflating points to either a singular instance in each location or slight shift by only truncating the coordinate marginally. This method can be used in combination with K-Means to further obfuscate data from the raw source data. Note that the spatial integrity of the data will depreciate with cycled manipulation, though it will further reduce risk of exposing raw data. Statistical validation is recommended to confirm processed results are still within the users threshold of tolerance and/or acceptability.
Bin Analysis
Sometimes called “Fish netting,” “Gridding,” or “Hex Binning” the data; Bin Analysis gives the user the ability to count the number of points within a specified shape.
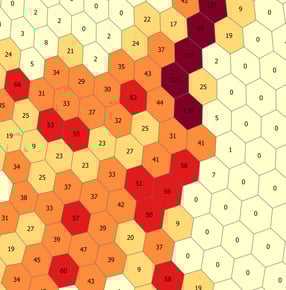
There are three main shapes available within the MapMasq tool: triangle, square, or hexagon. The size of the selected shape is an input variable that a user can modify (e.g. 30 square miles). All data points will be counted within the user specified bin and output as a layer for further analysis or graphical representation. It is important to note that this output is not a reflection of density, but a beautiful way to consolidate numerous data points into a systematic grid.
Additional Guidance
We hope this article has provided some value to you! If you ever need additional help, don't hesitate to reach out to the Axim team.