


This article may reference legacy company names: Continental Mapping, GISinc, or TSG Solutions. These three companies merged in January 2021 to form a new geospatial leader [Axim Geospatial].
Cityworks and Esri provide very powerful tools to visualize your Cityworks data. They can be used independently, or in conjunction with each other to analyze work activities and associated costs.
Cityworks Inbox
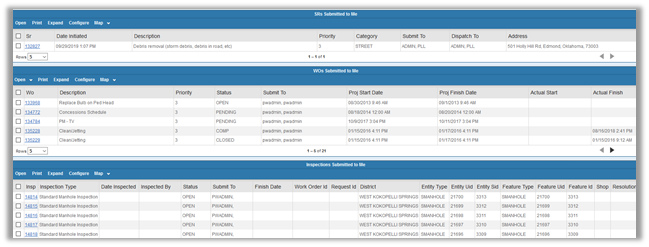
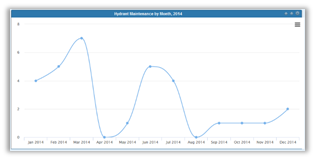
The Inbox within Cityworks is a powerful, yet easy to use dashboard option for displaying large amounts of user-defined work activity data. Within the Inbox, individuals can see lists of outstanding work activities assigned to them. Supervisors can monitor the progress of employees as they tackle their service requests, work orders and inspections. Inboxes also provide the ability to visualize data as charts, graphs, and maps to help your organizations stay knowledgeable on established metrics and KPIs.
eURLs and ArcGIS Dashboards
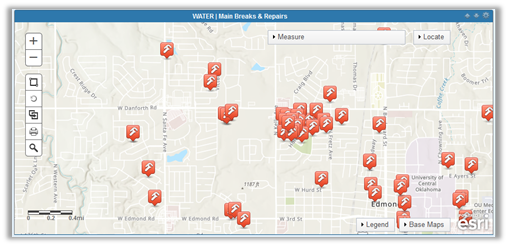
Cityworks eURLs are a method for displaying work activity data and locations in a web map. Utilizing saved queries, the eURL can provide live data to an Esri Operations Dashboard. The Operations Dashboard is a web application that can consume the Cityworks eURL and provide numerous options for display. This can support stakeholders charged with making decisions about budgets, manpower, and performance metrics.
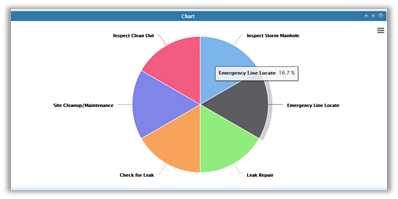
eURLs are a way to share Cityworks work activity information using dynamic web services, providing a live data stream into ArcGIS Online and Portal. Operations Dashboards can be configured in both ArcGIS Online and Portal and are web applications that can consume the Cityworks eURL services and provide numerous options for display: charts, graphs, maps, and etc. Dashboards can be shared publicly to better inform citizens, or used internally to support stakeholders making staffing and budgetary decisions, by easily displaying performance-based metrics. Although similar to the native Cityworks Inbox, Operations Dashboards complement and extend the visualization capabilities of Cityworks, and can even be embedded within the Inbox directly.
Read: The 6 Biggest Mistakes People Make When Creating an ArcGIS Dashboard
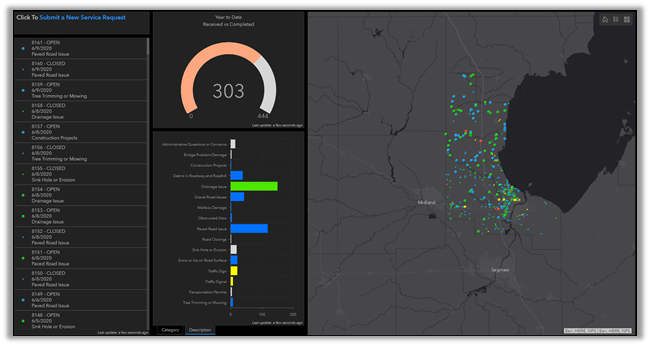
This dashboard provides a multi-view of service requests, including a list, by category, location map, and gauge showing completed work.
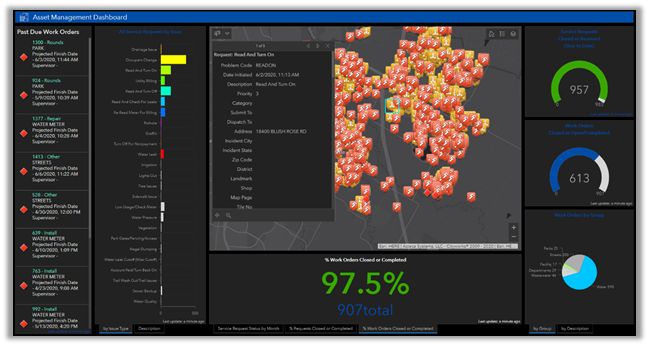
This dashboard displays a similar view of various metrics related to Service Requests and Work Orders.
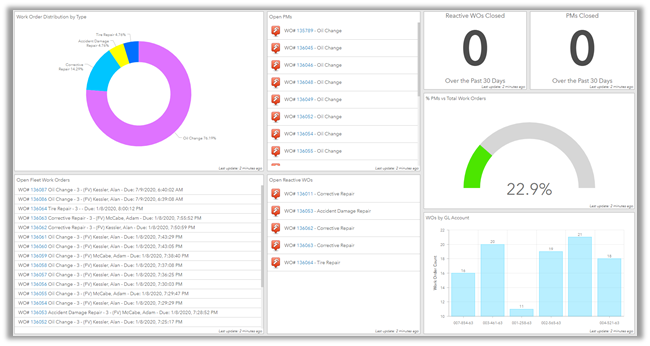
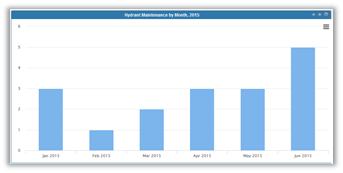
In this example, the organization is tracking preventative maintenance on their fleet in Cityworks and displaying the data in an Esri dashboard.
Additional Guidance
We hope this blog on visualizing your Cityworks data has provided some value to you! If you ever need additional Cityworks help, don't hesitate to reach out to the Axim team.